ANALYZE
Software to Evaluate Time-Series, Test, & Telemetry Data
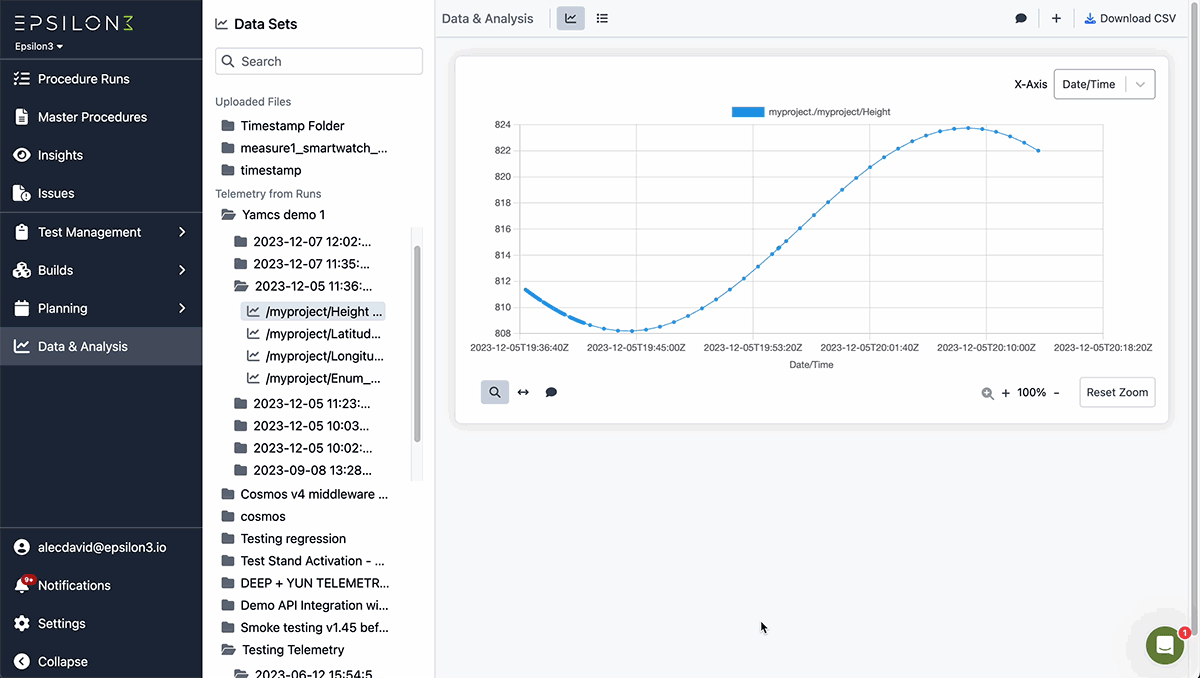
Plotting tools help you identify valuable insights that enable quick, data-driven decisions.

MODERNIZE
Automate Data Collection
Unlike Excel and siloed data analysis software, Epsilon3 collects complex data sets and transforms them into easy-to-read charts, without the need for any manual data entry.

OPTIMIZE
Visualize & Improve Outcomes
Quickly observe trends and mitigate performance issues when all the data is laid out in front of you in a visual format. Maintain a digital thread to optimize traceability as your organization scales.

Goodbye, manual data processing and plotting.
Hello, future.


Product Demo

CUSTOMERS
Built for Space; Powerful Enough for Any Operation


“Epsilon3 allows us to optimize the creation, review, and execution of our procedures. Their Web-based platform enables us to develop, iterate, and execute at the speed required to be successful.”
- Meagan Roth, Launch Operations Manager
“Epsilon3 has transformed our operations by enabling efficient procedure management, real-time collaboration, and automated reporting. It's the ideal tool for scaling our test environment.”
- Andy Mack, Propulsion Test Engineer
“Epsilon3 enables our engineering and operations teams to stay connected; and their suite of tools support critical assembly, integration, and testing (AIT) procedures, reducing risk and ensuring mission assurance."
- Sean Davis, Production Manager
More about our Analyze product
Cloud solution for storage and retrieval of time series data
Tools for plotting to help you gain valuable insights and make informed decisions before your next run or test
Plot multiple time series datasets or overlay data from past events to generate awareness and discover insights
Stream, plot and analyze realtime data from your testbed, vehicle, etc
Take control of your data and manage it in one central location – right next to your procedures and test artifacts
Upload and visualize entire data sets from .csv files
Need to find a slice of data from a key moment in a test? Explore the data visually with pan, zoom, and filter tools, and even export the data for further analysis in other software tools
Discover key insights and explore your data analytically with equations and computations
Compute averages, limits, and other mathematical expressions using your time series data as inputs